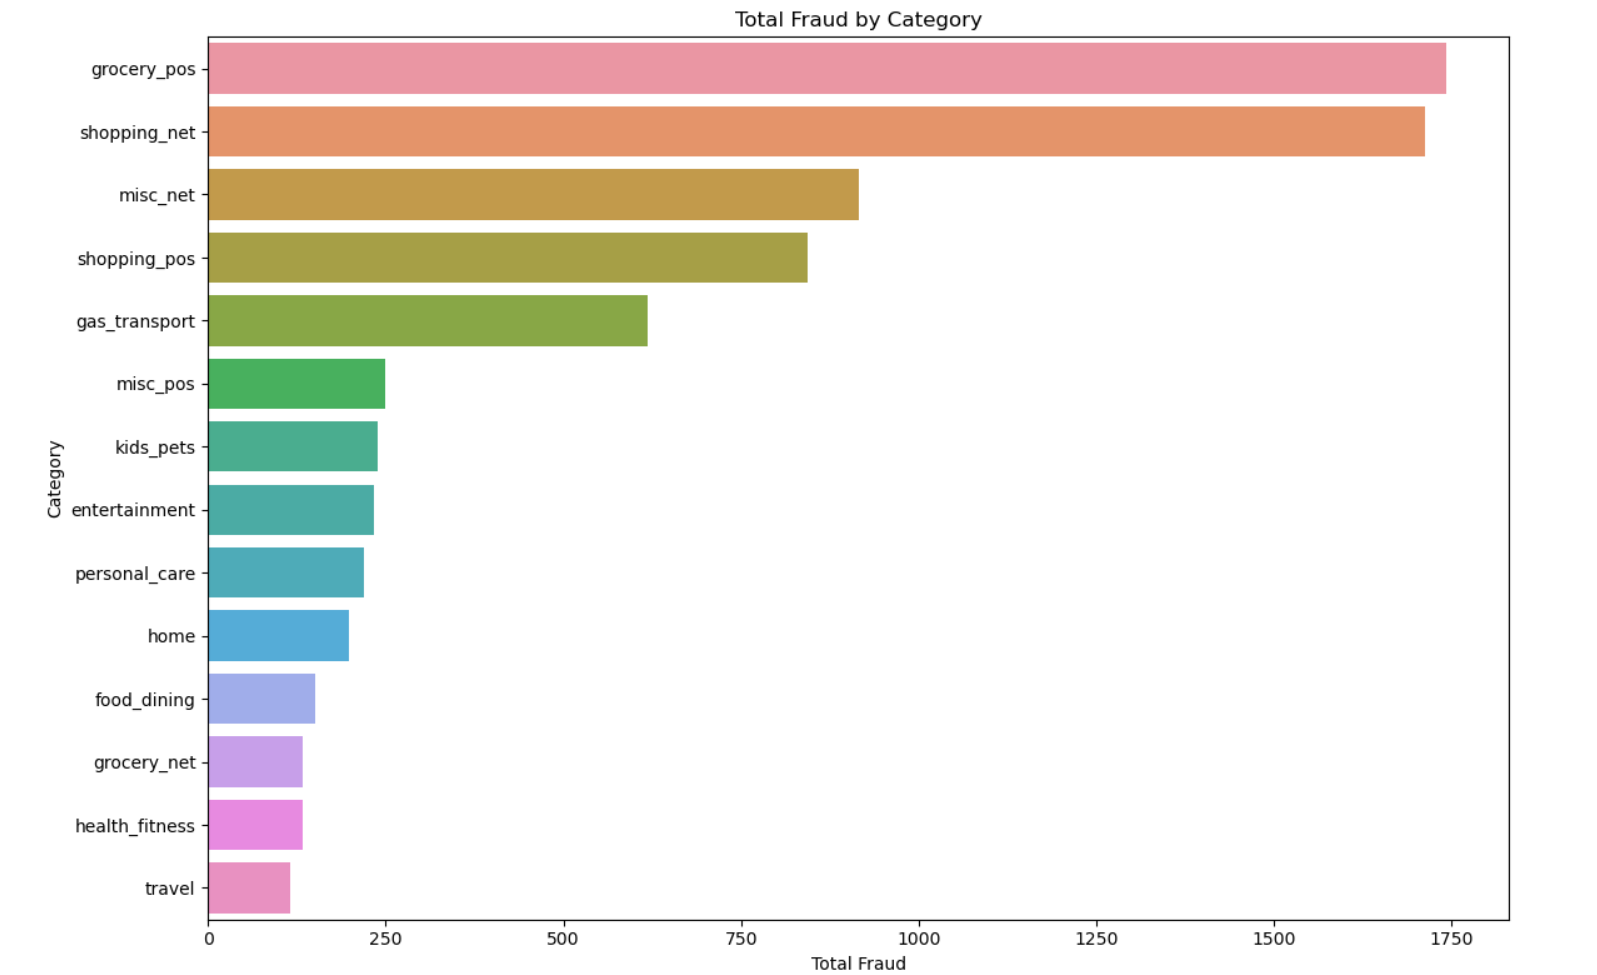
Total fraud by category
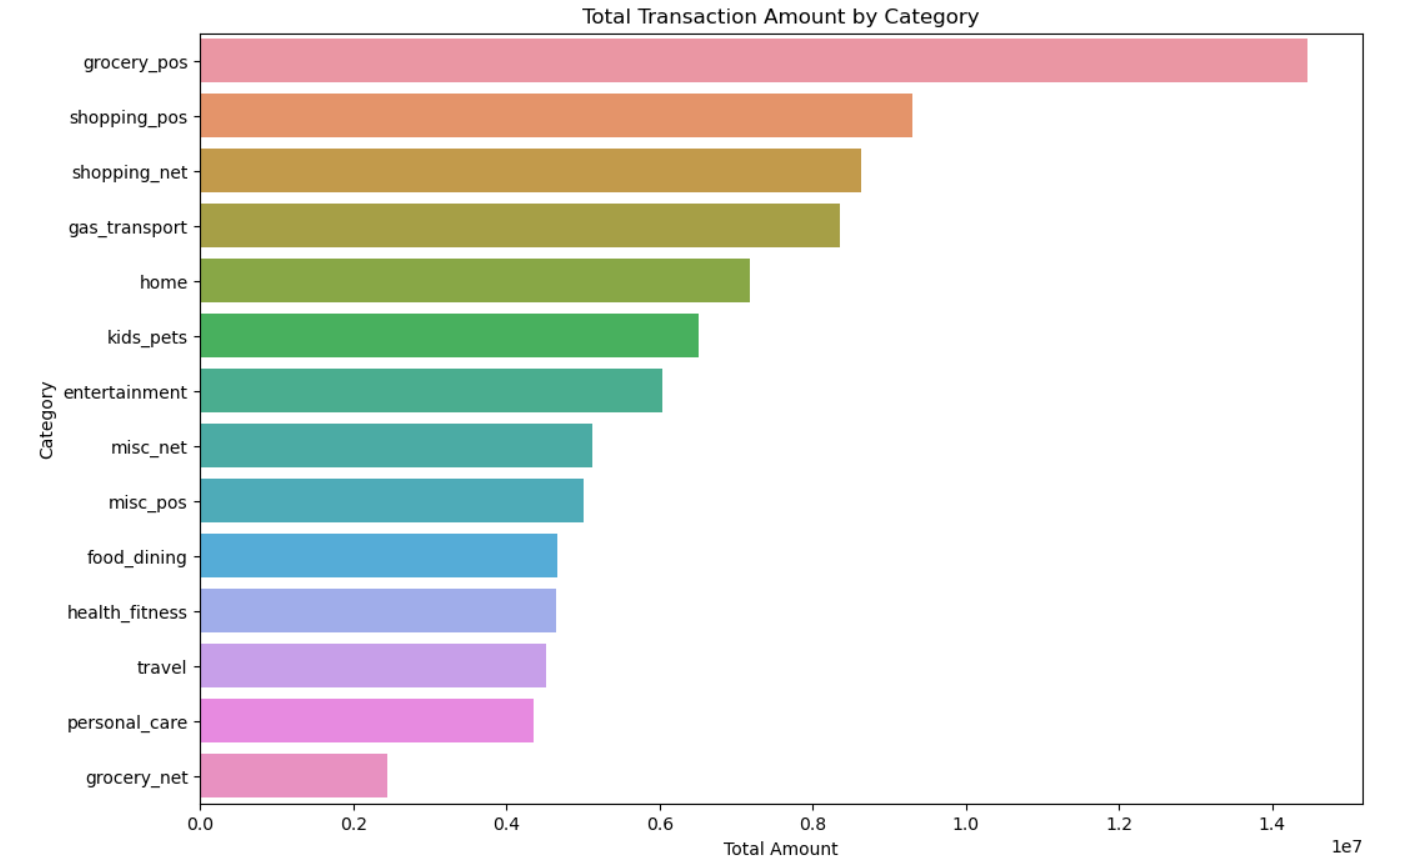
Total transaction amount by category
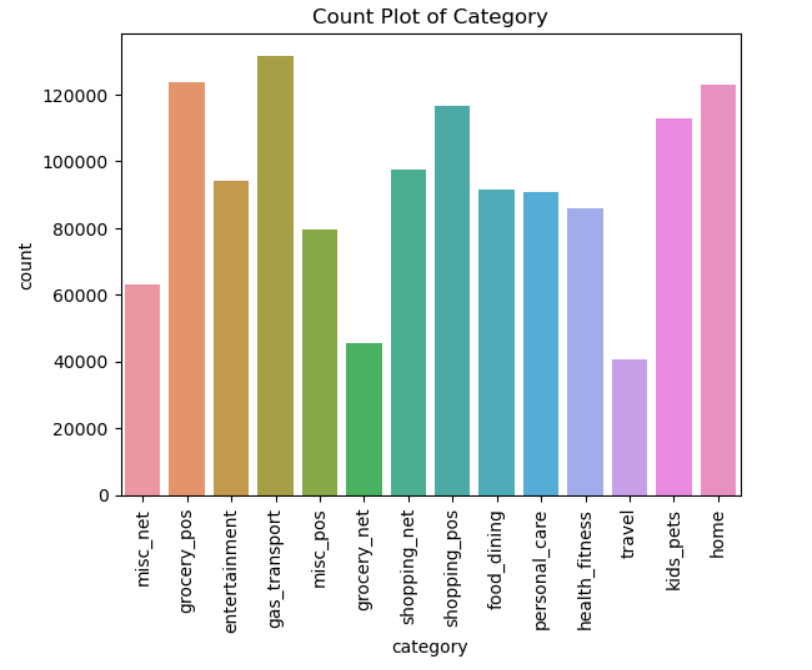
Count plot of category
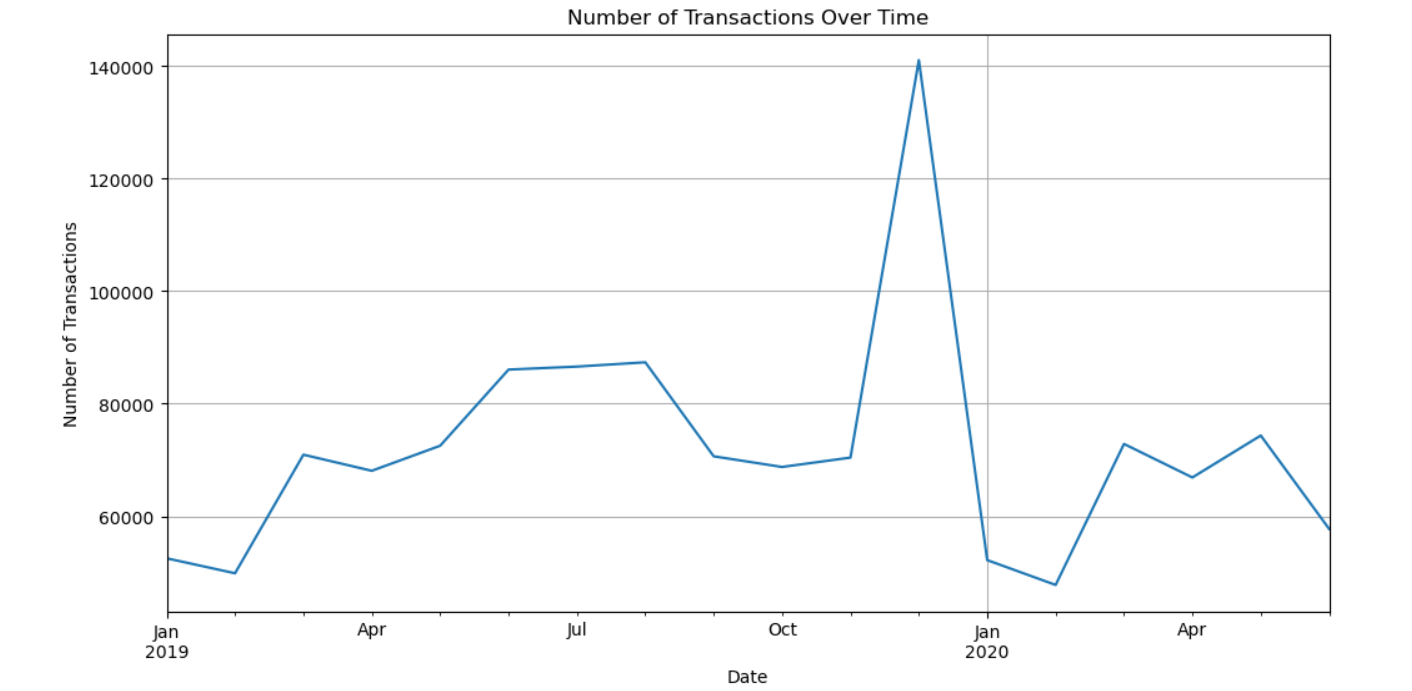
Total transaction amount by date
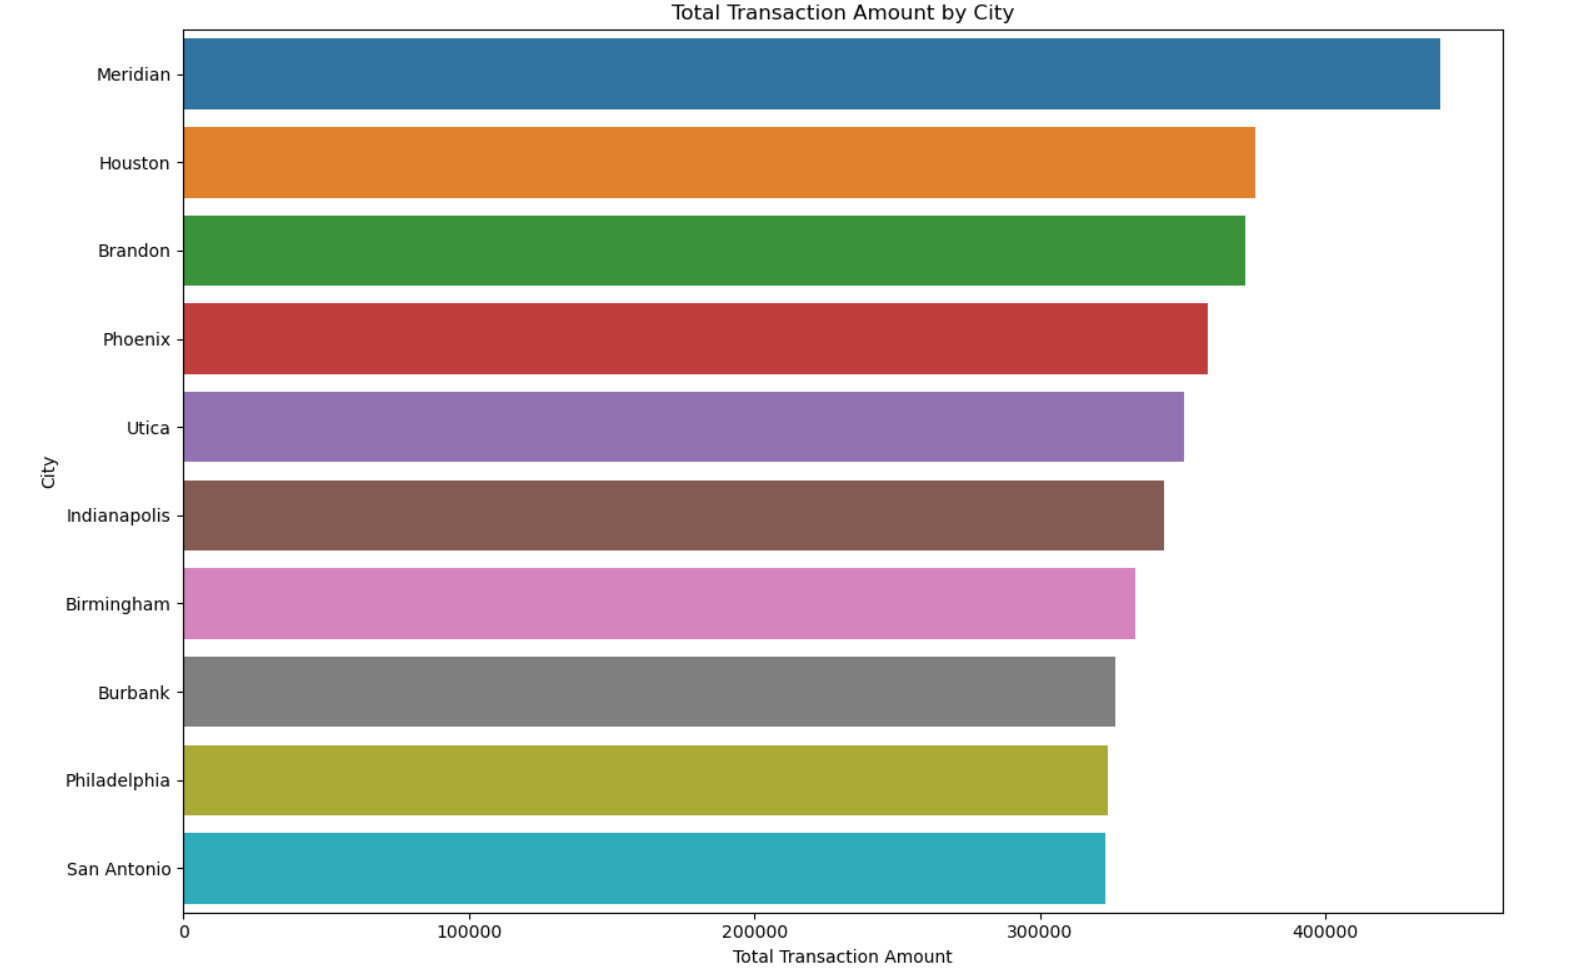
Total transaction amount by city
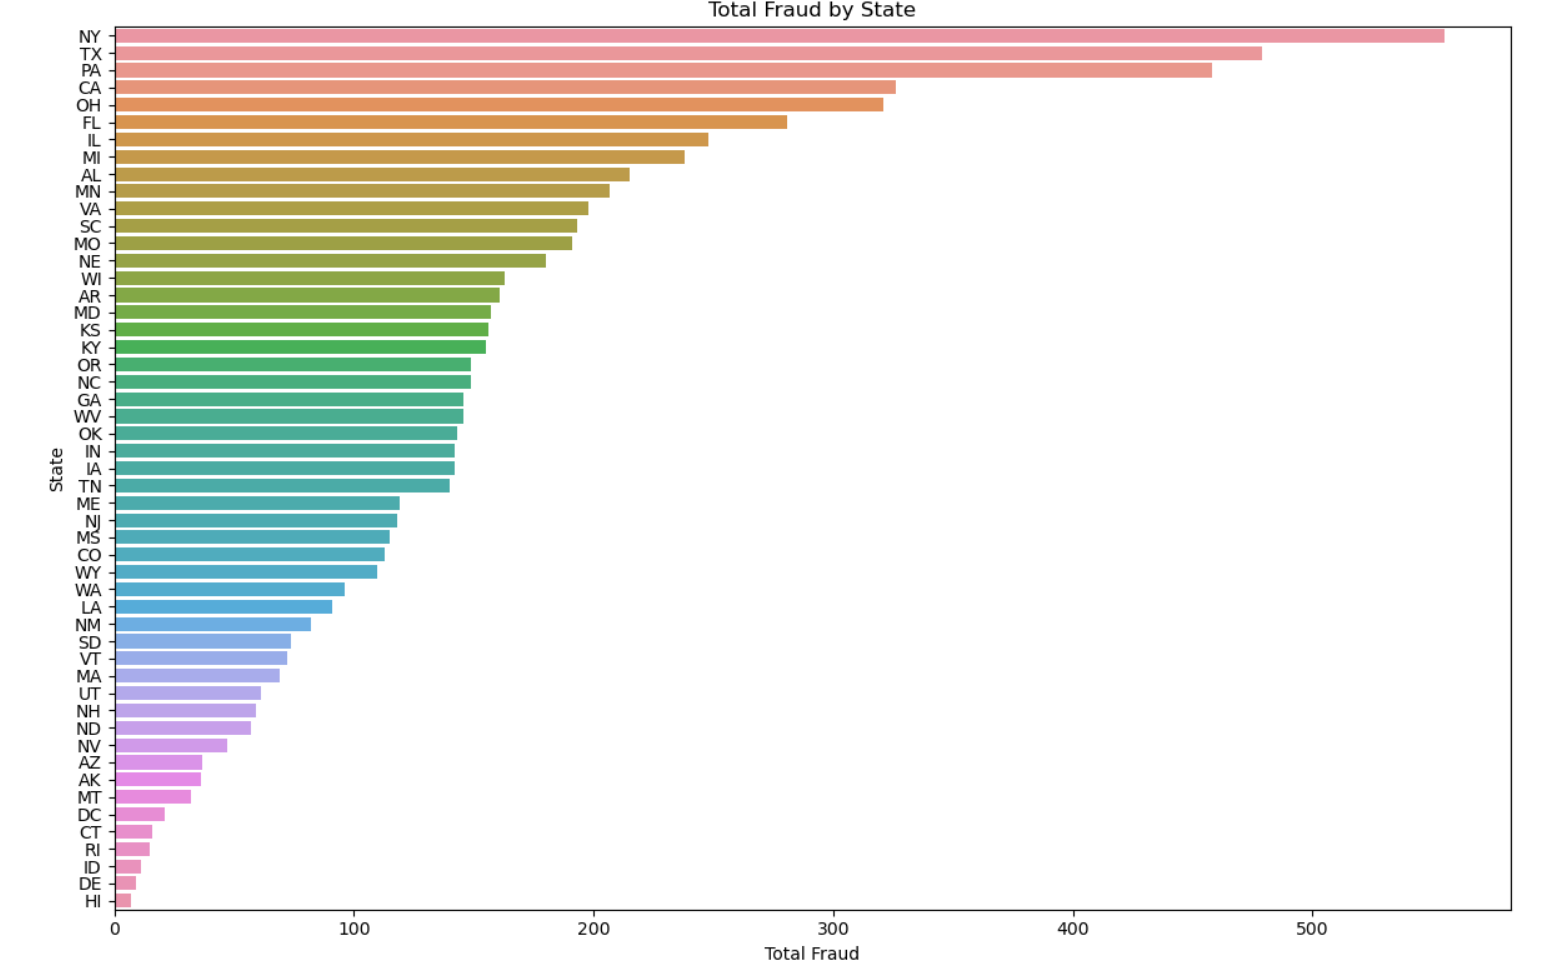
Total fraud by state
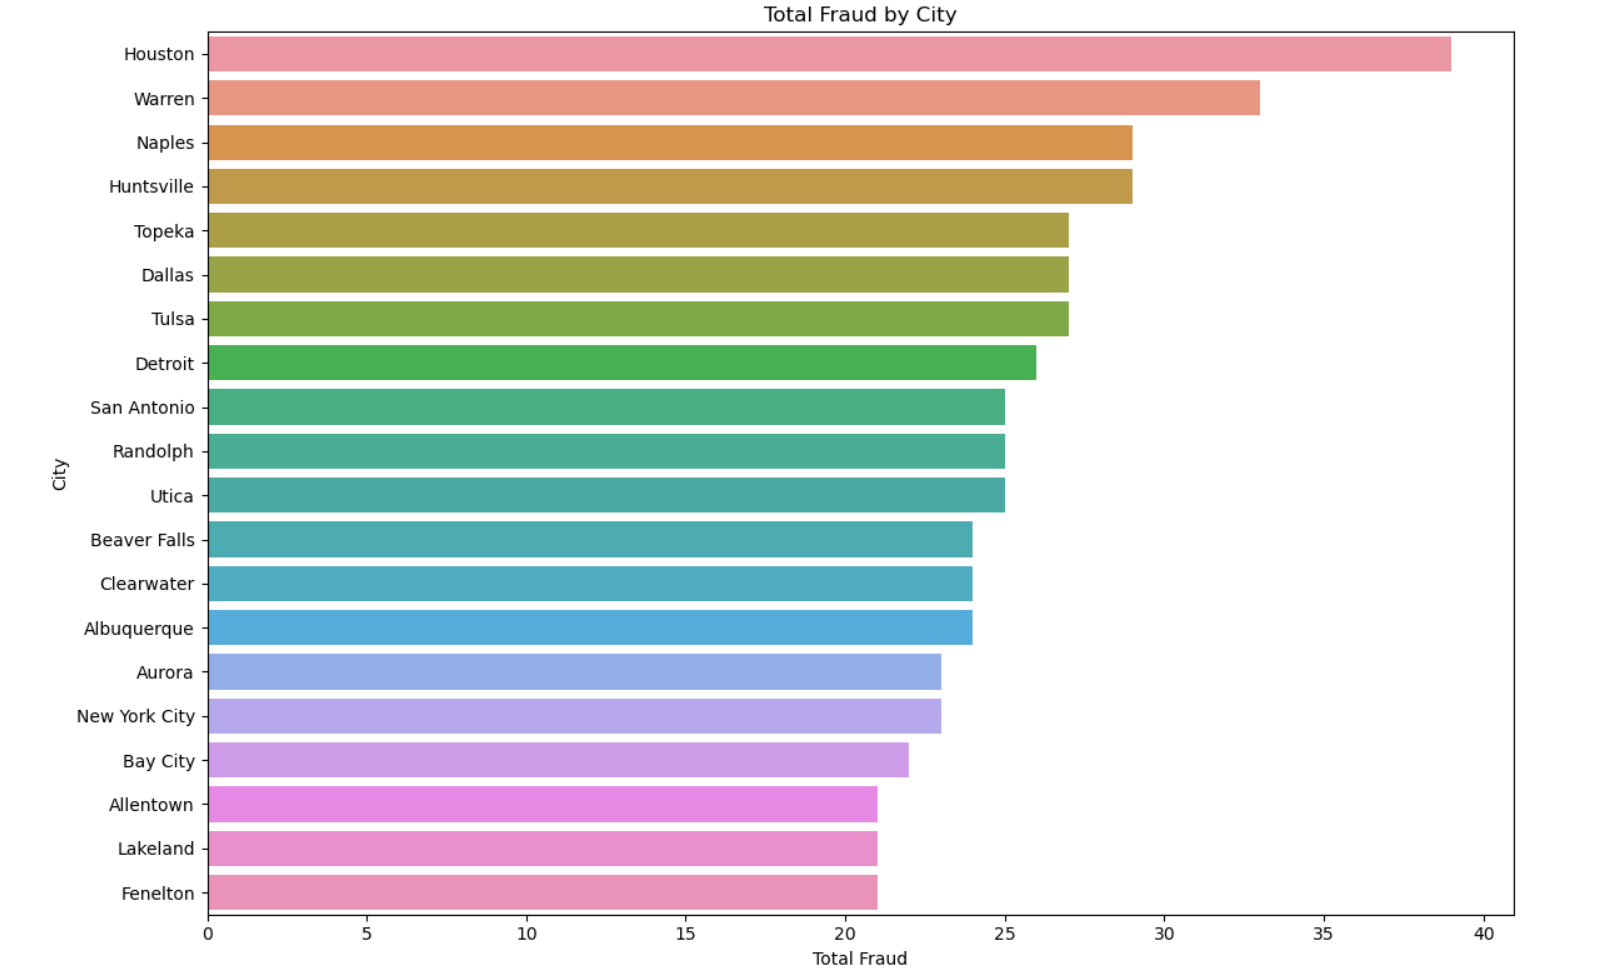
Total fraud by city
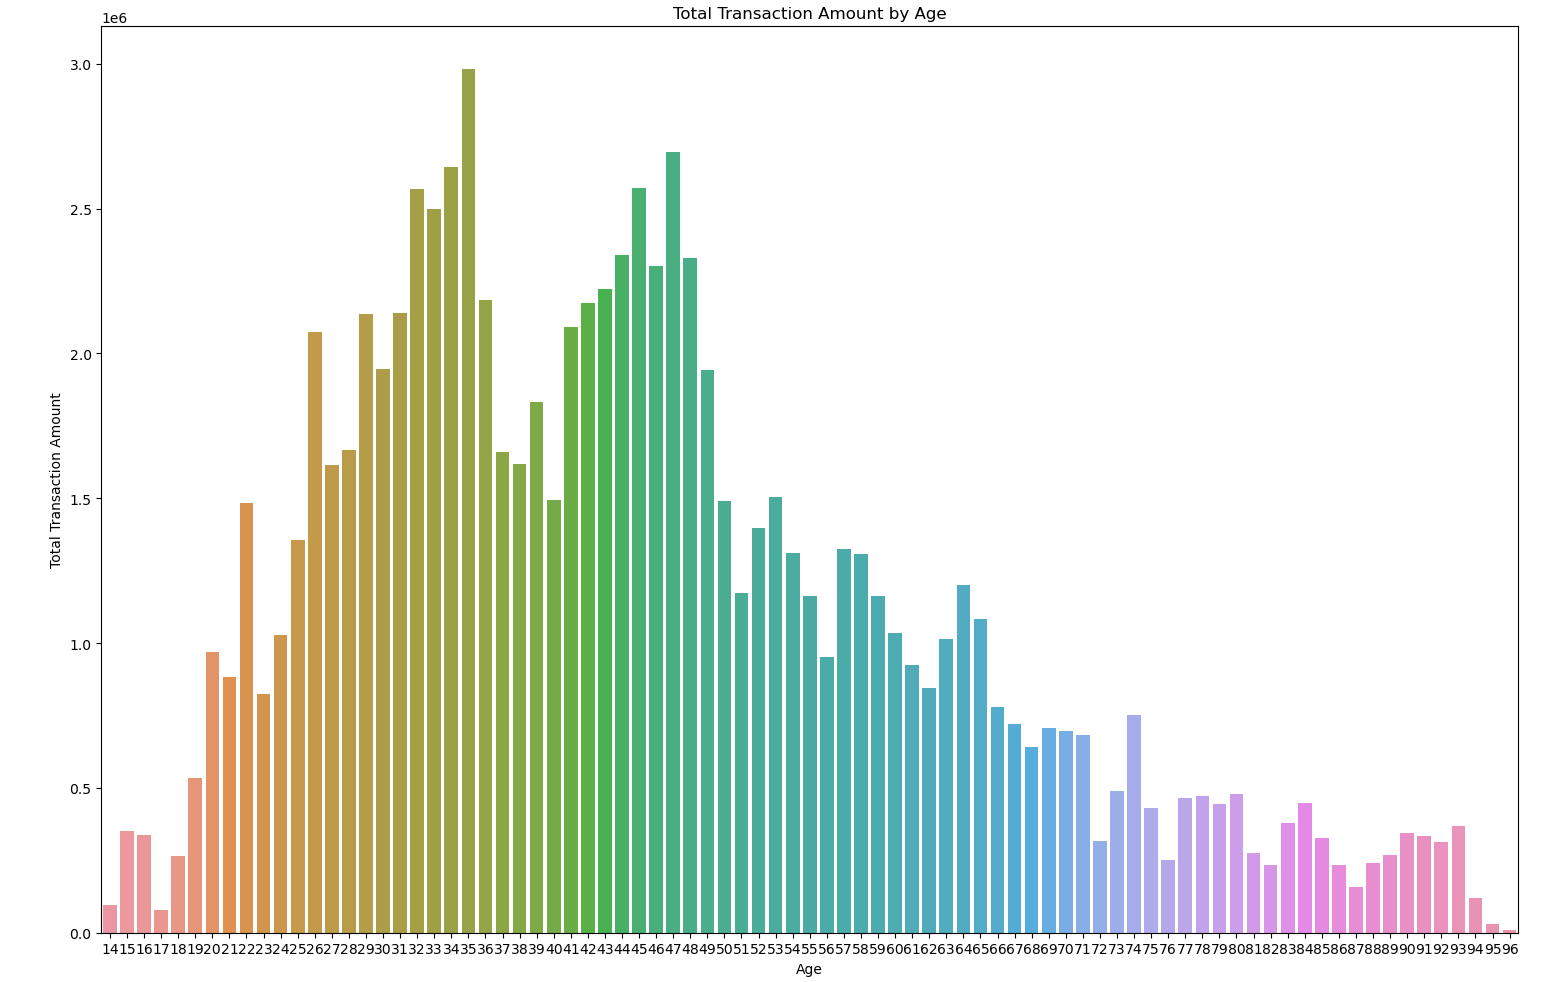
Total transaction amount by age

Distribution of transaction amounts
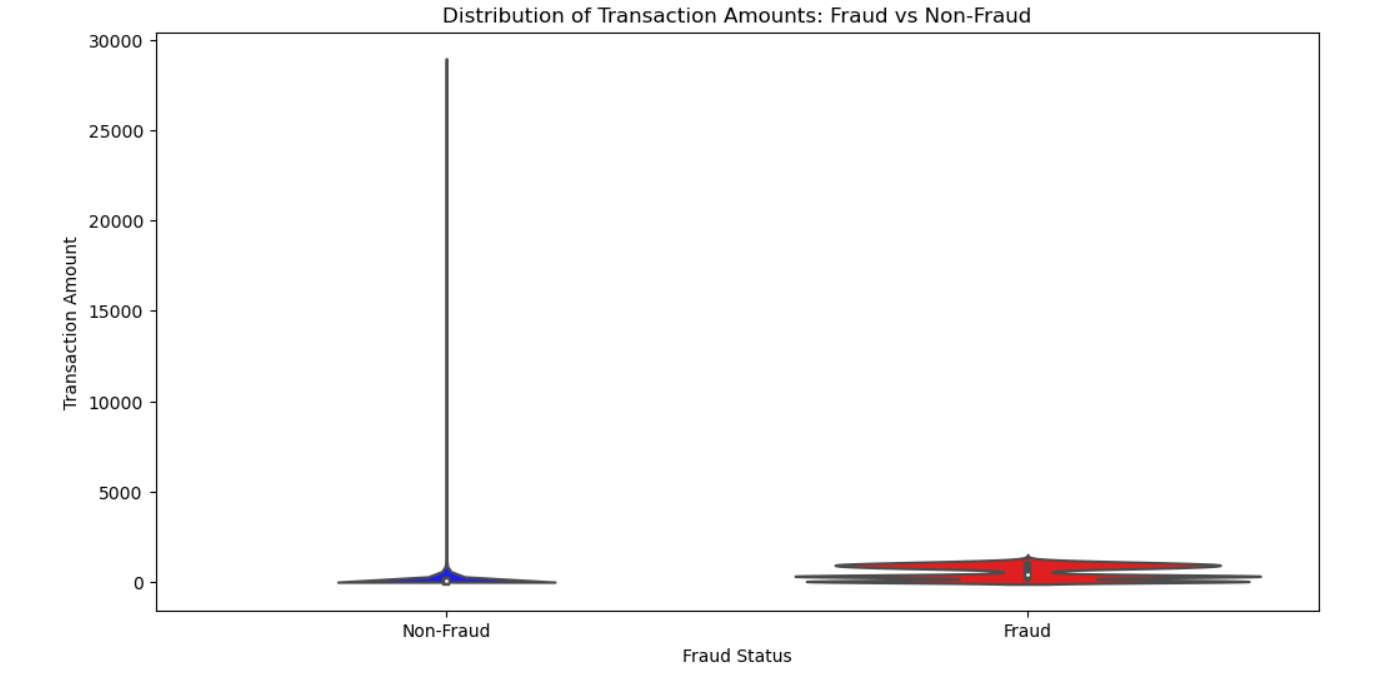
Distribution of transaction amounts violin
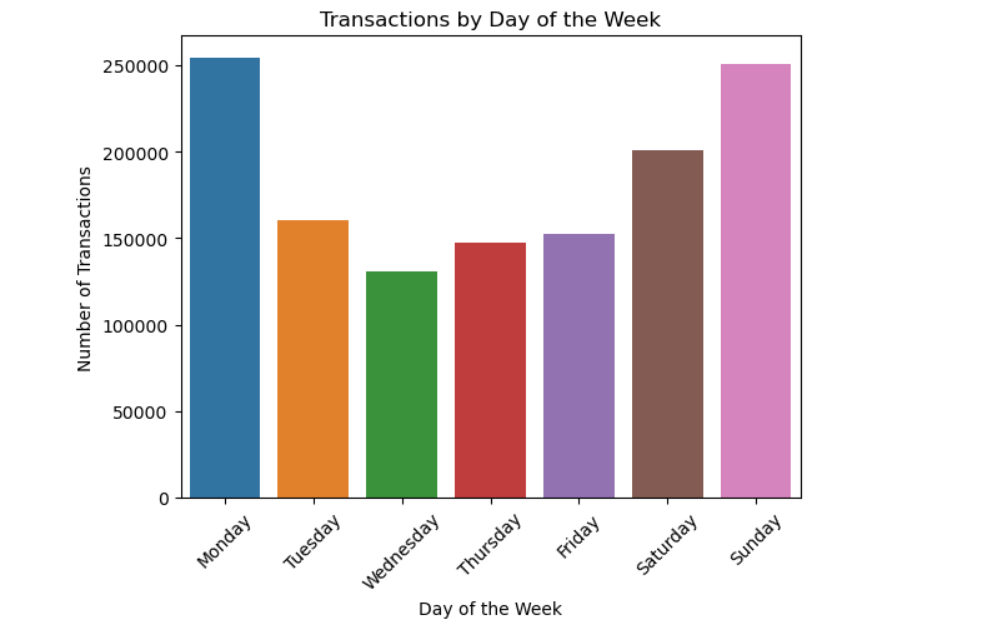
Transactions by day of the week
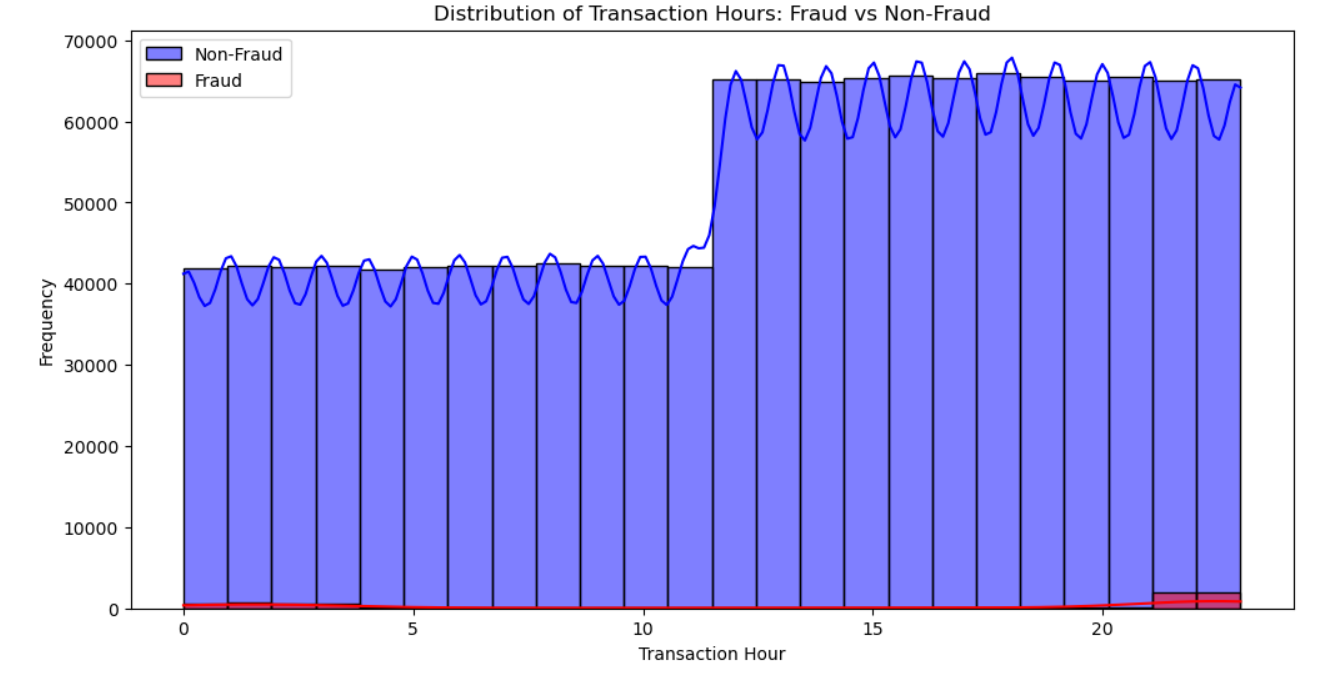
Distribution of transaction hours
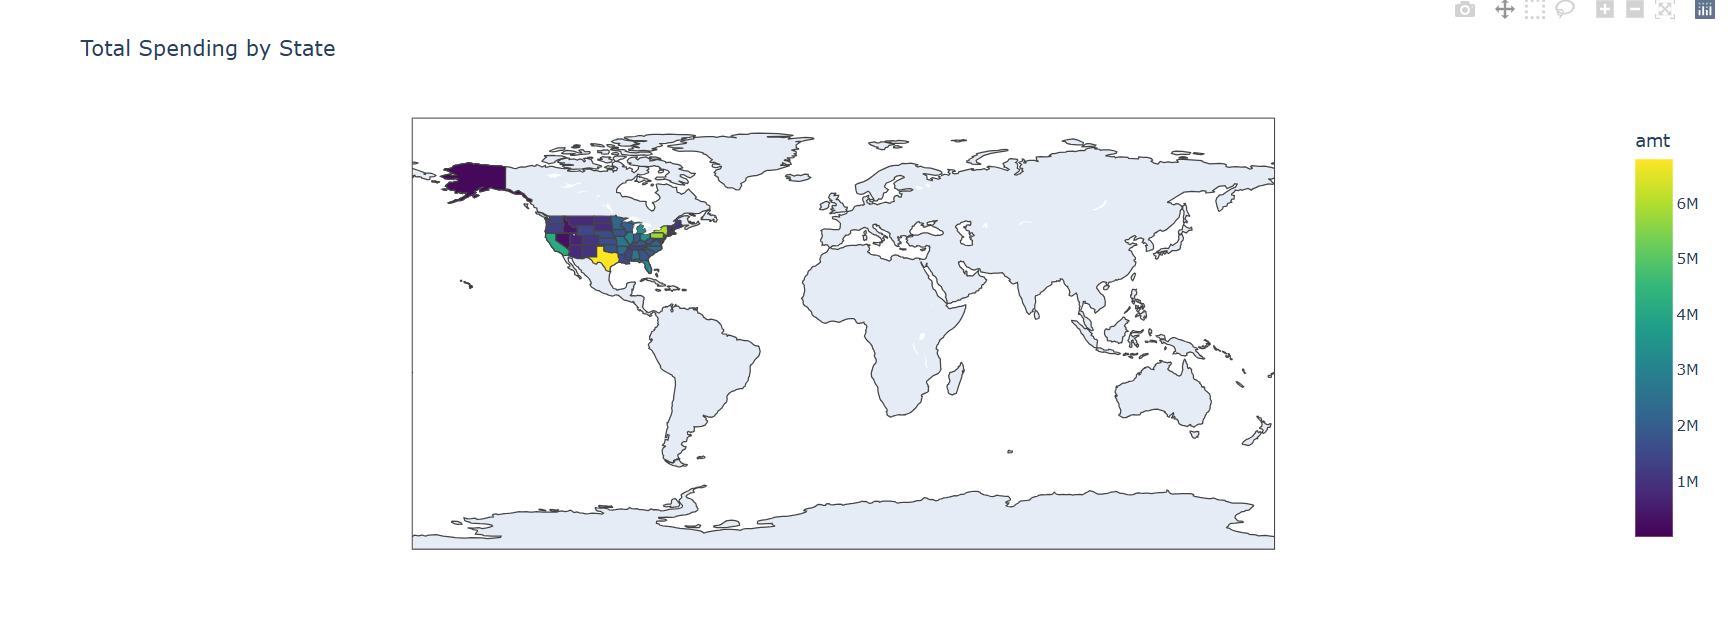
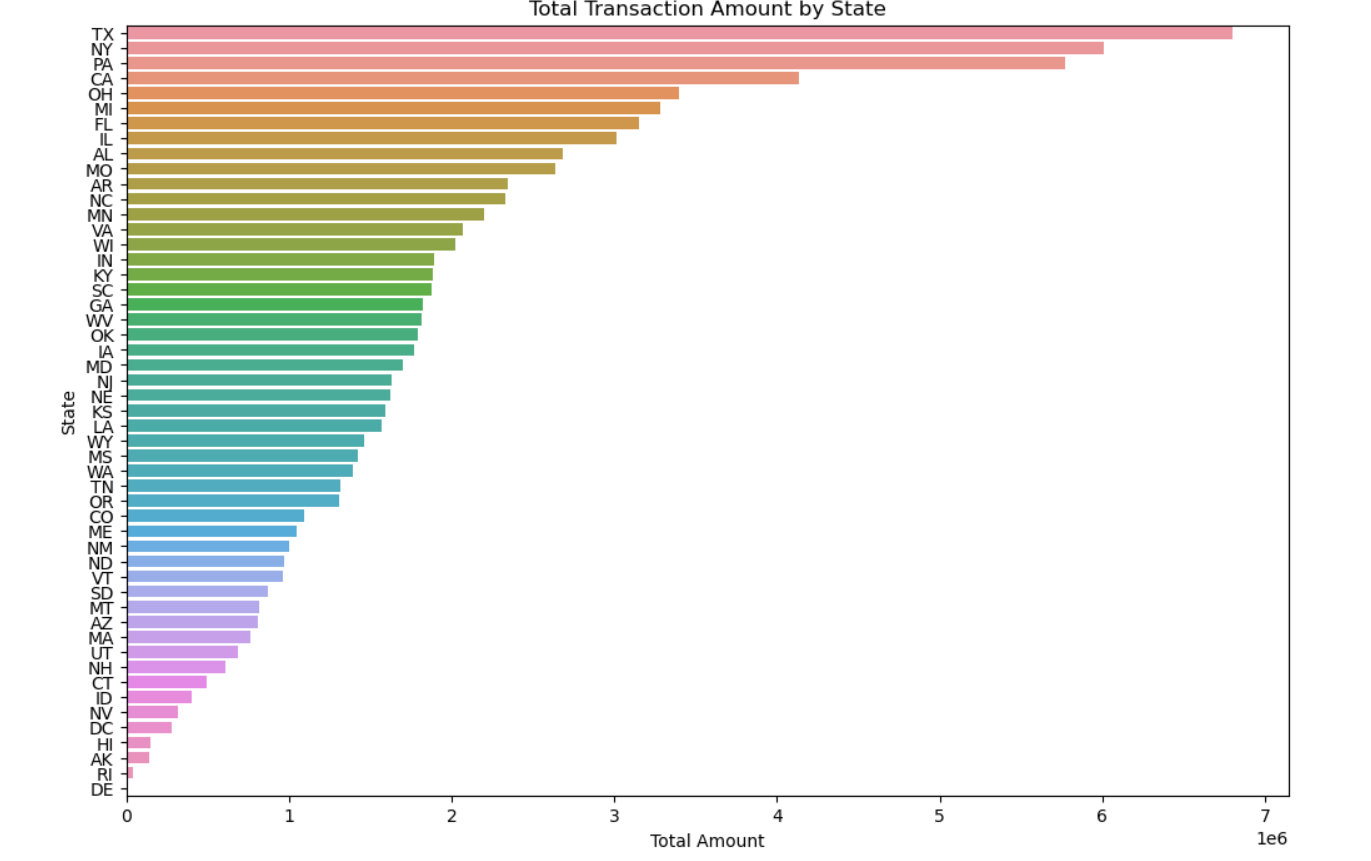
Total spending by state
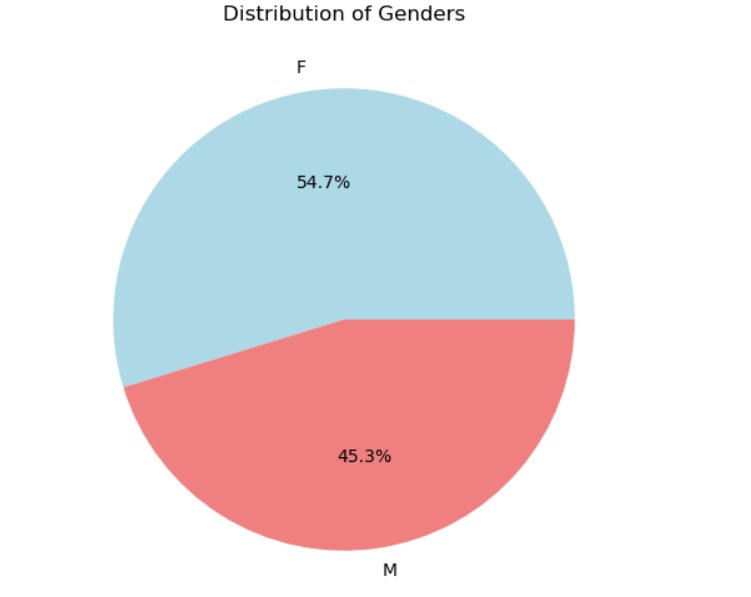
Distribution of genders
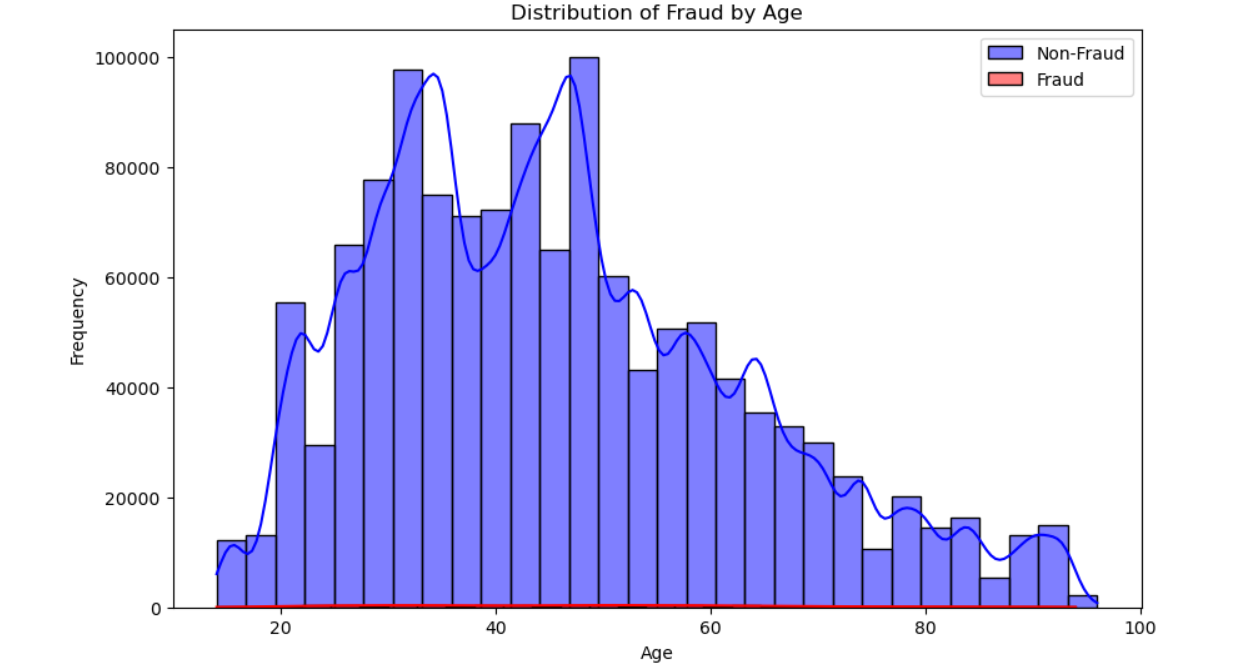
Distribution of fraud by age